
Standard dashboards
Doctrin provides a standard analytics dashboard for each health care unit. This article describes each widget: what it measures, and which filters apply (in addition to the global Date and Time Interval filters).
Table of contents
- Top section
- Cases and sendouts by time interval
- Cases by profession
- Age and gender
- Top 30 questionnaires
- Handling time
- Waiting time within opening hours
- Waiting times
- Drop-offs
- Profession collaboration
- Video calls
- Feedback
- Patient feedback
Top section
All 4 widgets show the number of cases/sendouts within the selected date range.
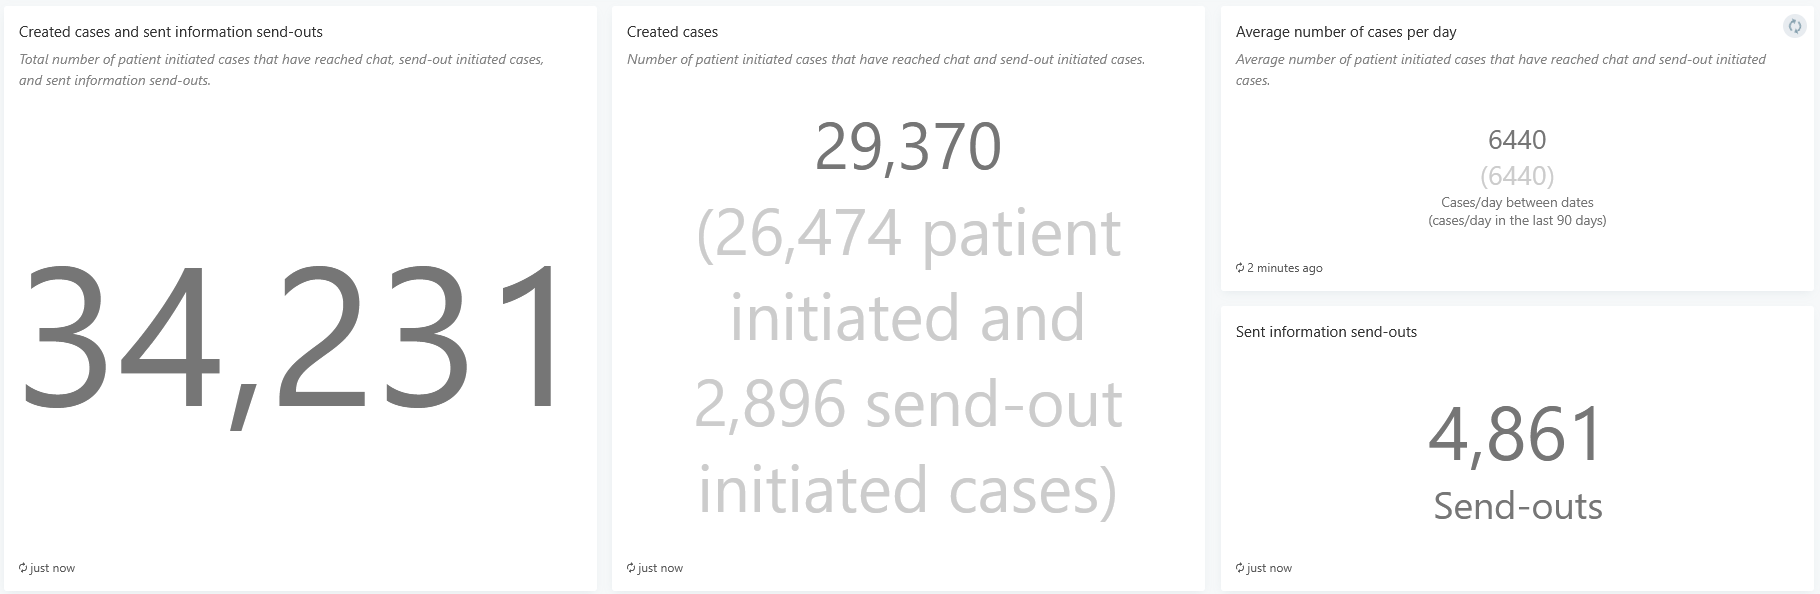
1. Created cases and sent information send-outs
Shows all cases that were created within the selected date range, and the number of information sendouts sent within the same range. Cases with a create date (or sendouts with a sent date) outside the selected range are not included.
| Measure | Filters |
|---|---|
| cases | create date within date range; has reached chat |
| sendouts | send date within date range; only information sendouts |
2. Created cases
Number of cases — initiated by patient or by sendout — that reached chat and were created within the selected date range.
| Measure | Filters |
|---|---|
| cases | create date within date range; has reached chat |
3. Average number of cases per day
Average number of cases that reached chat within the selected date range, compared against the same average over the last 90 days.
| Measure | Filters |
|---|---|
| cases | create date within date range; has reached chat |
4. Sent information send-outs
Number of information sendouts (with and without confirmation) where the sent date falls within the selected date range.
| Measure | Filters |
|---|---|
| sendouts | send date within date range; only information sendouts |
Cases and sendouts by time interval
Both widgets show figures per selected time interval (day/week/month).
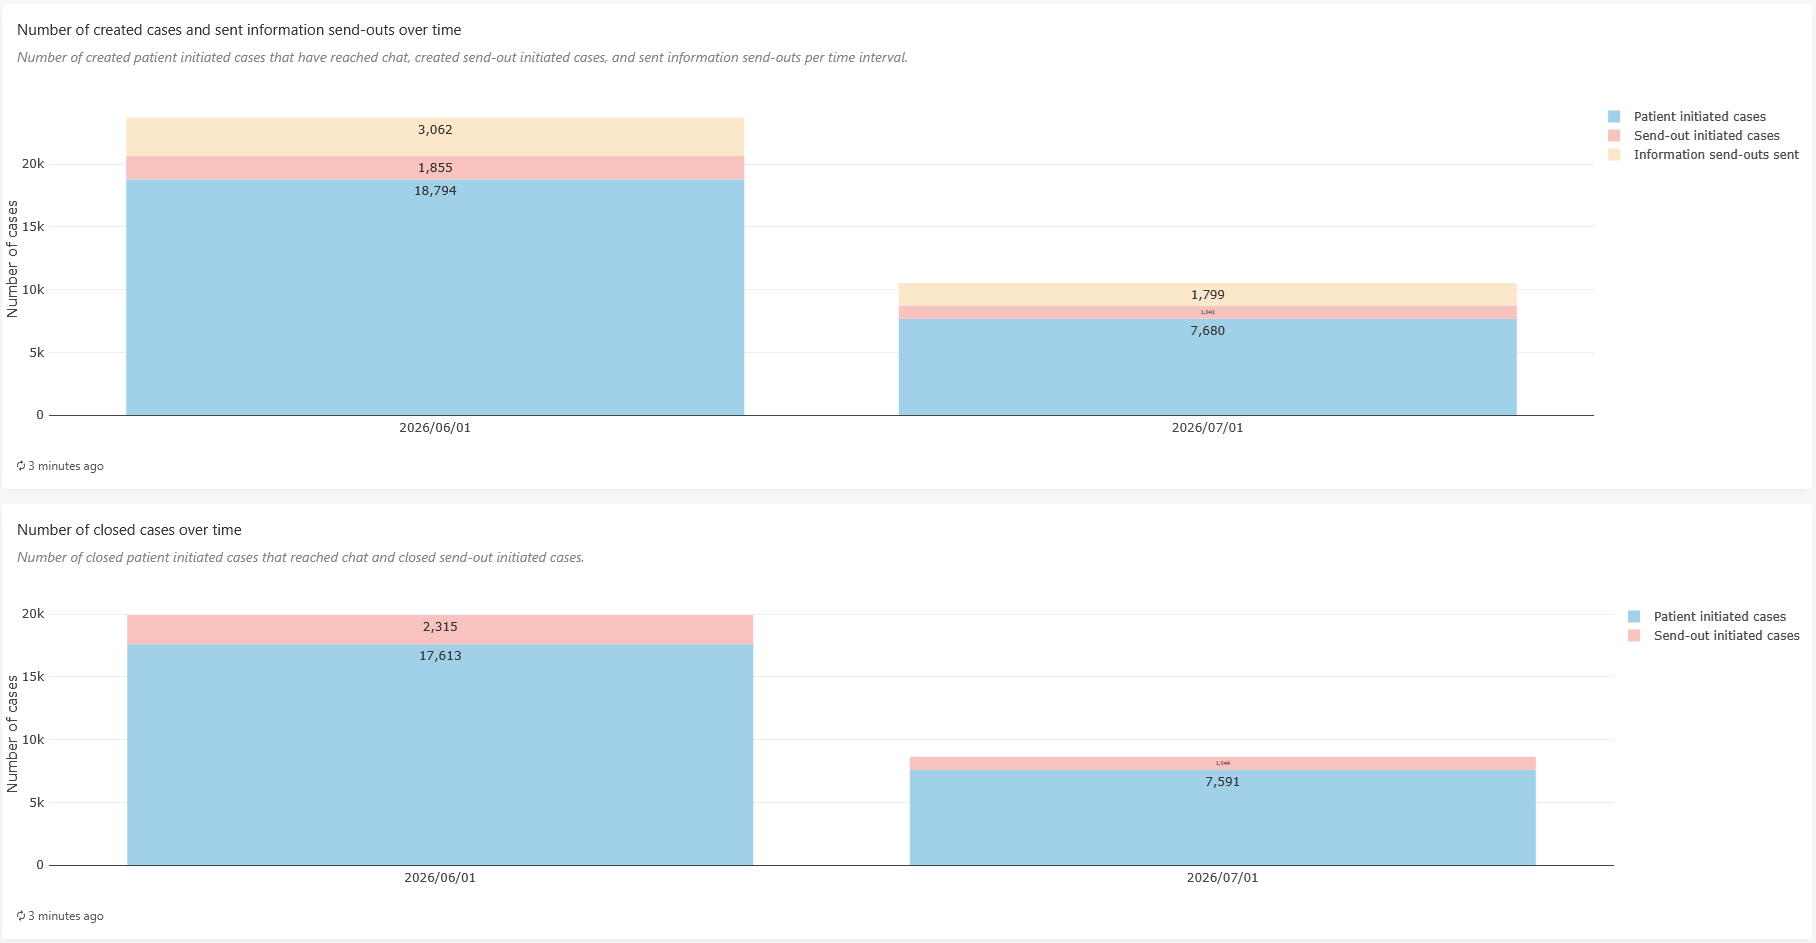
5. Number of created cases and sent information send-outs over time
Number of cases that reached chat and information sendouts sent within the selected date range, grouped by day/week/month.
| Measure | Filters |
|---|---|
| cases | create date within date range; has reached chat |
| sendouts | send date within date range; only information sendouts |
6. Number of closed cases over time
Number of cases that reached chat and were closed within the selected date range, grouped by time interval.
| Measure | Filters |
|---|---|
| cases | close date within date range; only closed cases |
Cases by profession
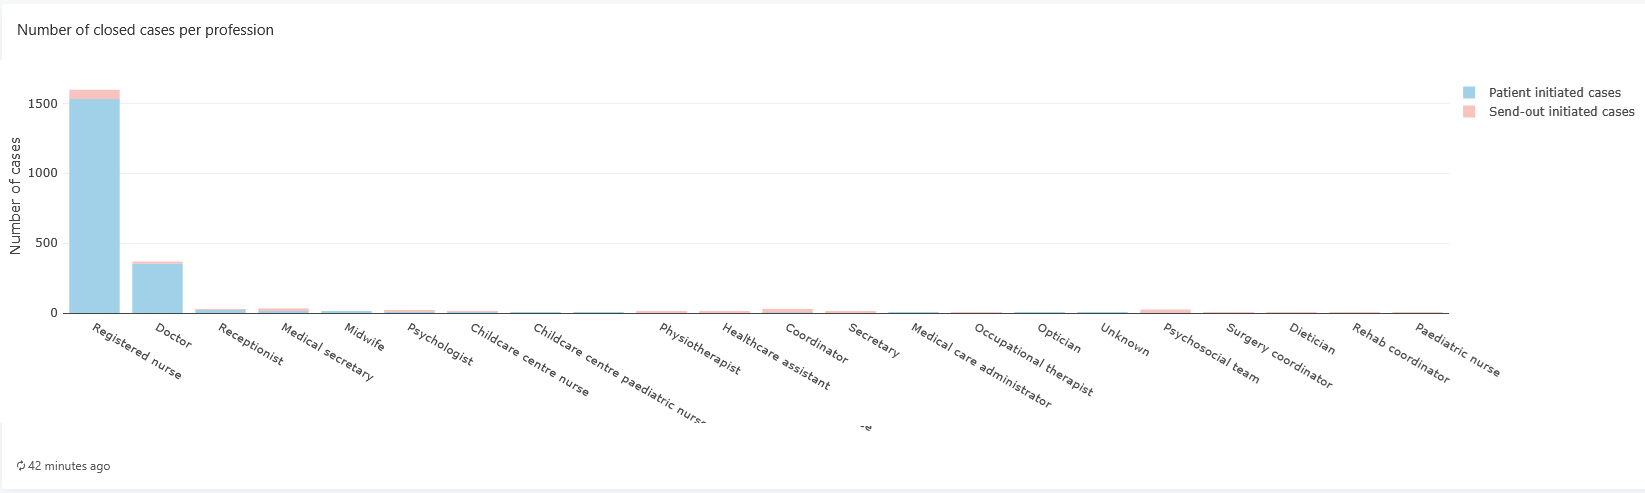
7. Number of closed cases per profession
Number of cases created within the selected date range, per assigned profession (last assigned profession).
| Measure | Filters |
|---|---|
| cases | create date within date range; has reached chat |
Age and gender
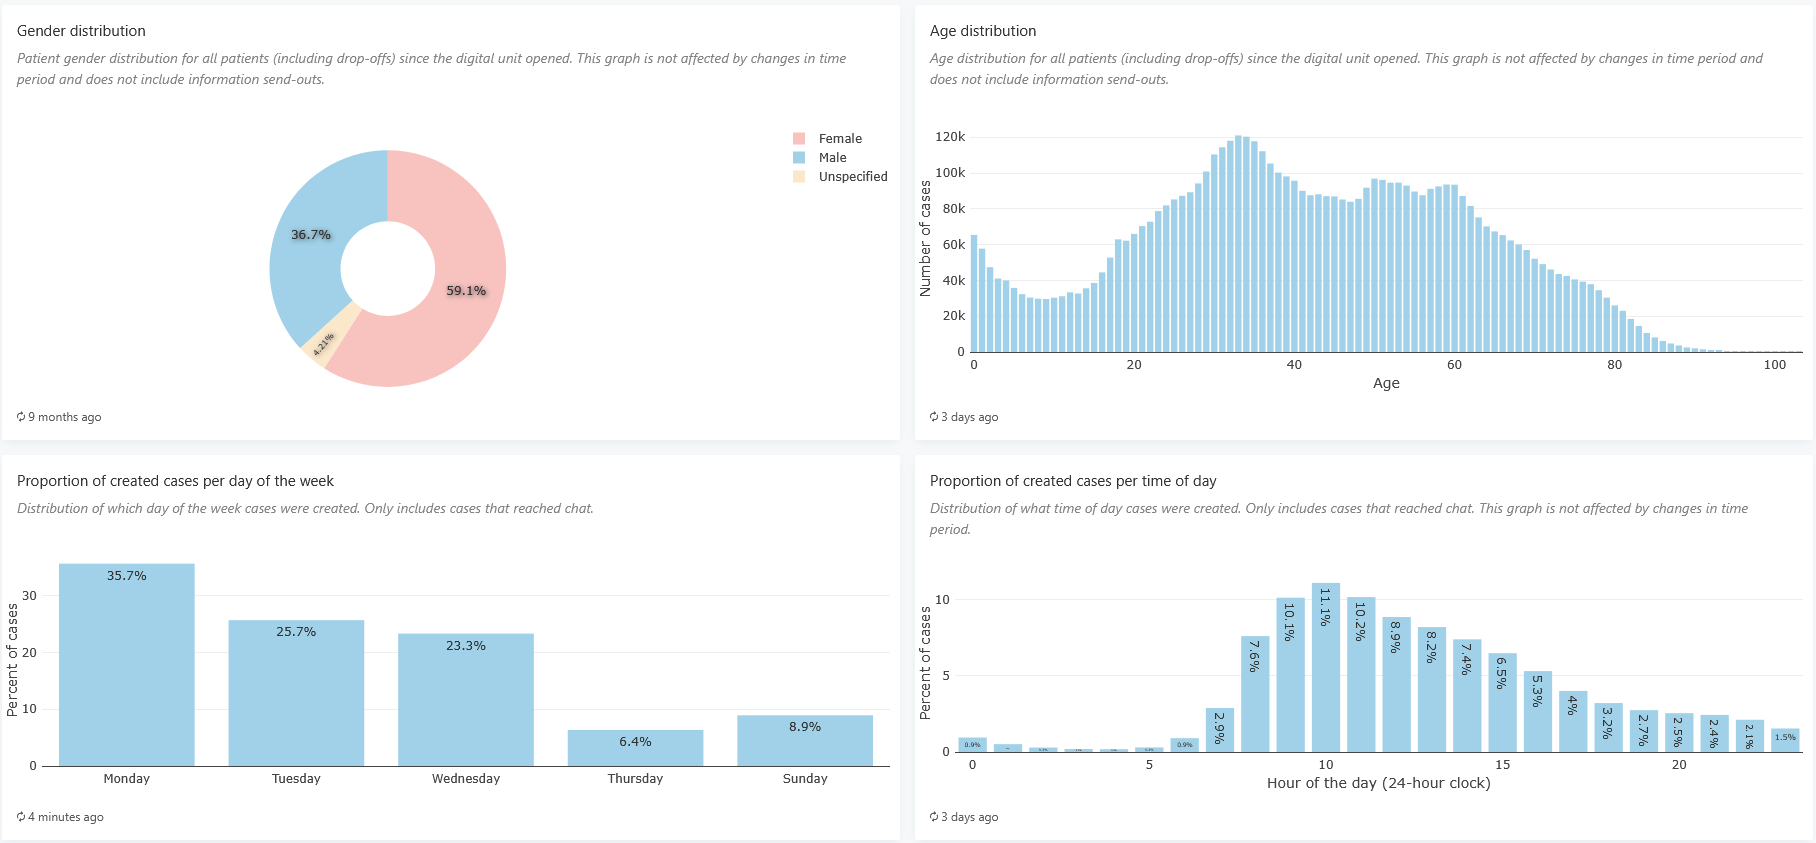
8. Gender distribution
Gender distribution.
| Measure | Filters |
|---|---|
| gender | no date range filter |
9. Age distribution
Number of cases per patient age.
| Measure | Filters |
|---|---|
| age | no date range filter |
10. Proportion of created cases per day of the week
Number of cases that reached chat and were created within the selected date range, grouped by weekday.
| Measure | Filters |
|---|---|
| cases | create date within date range; has reached chat |
11. Proportion of created cases per time of day
Number of completed patient onboardings, grouped by hour of day.
| Measure | Filters |
|---|---|
| hour | no date range filter |
Top 30 questionnaires
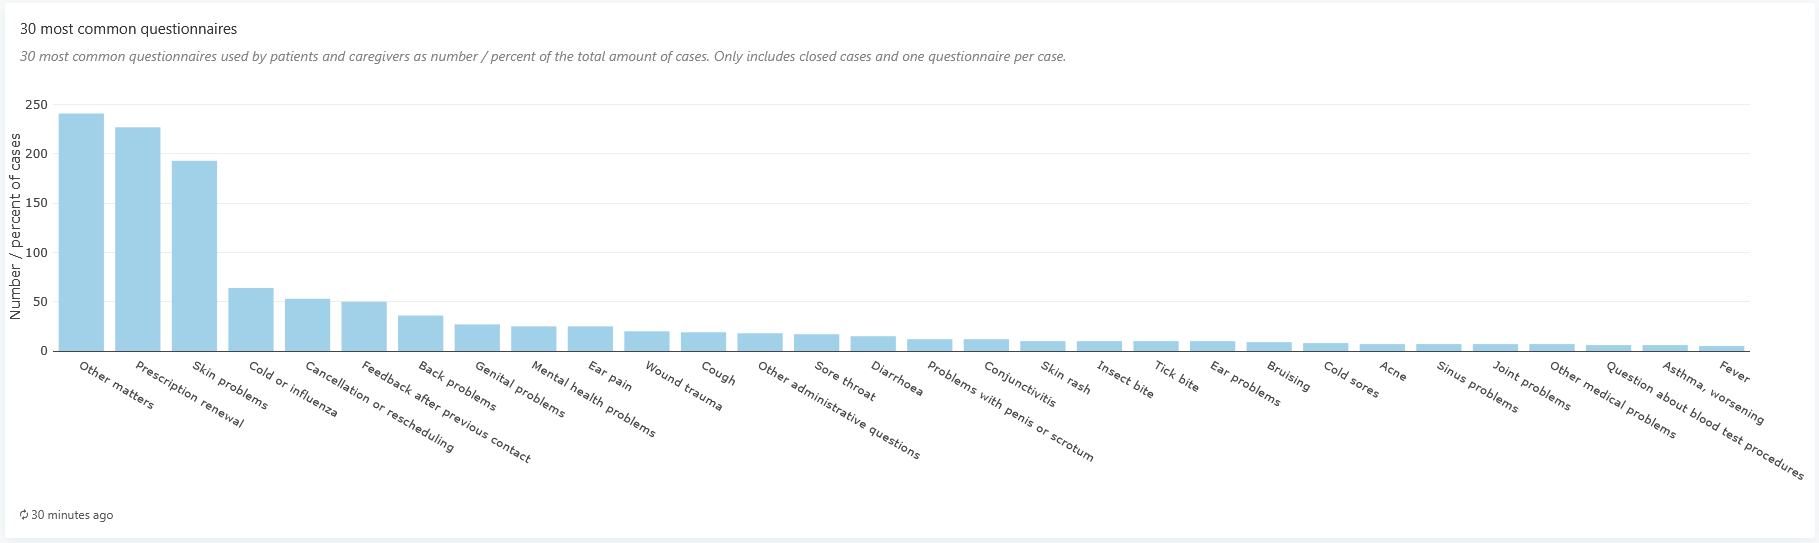
12. 30 most common questionnaires
Most used questionnaires in cases created within the selected date range.
| Measure | Filters |
|---|---|
| cases | create date within date range; has reached chat; anonymised cases excluded |
Handling time
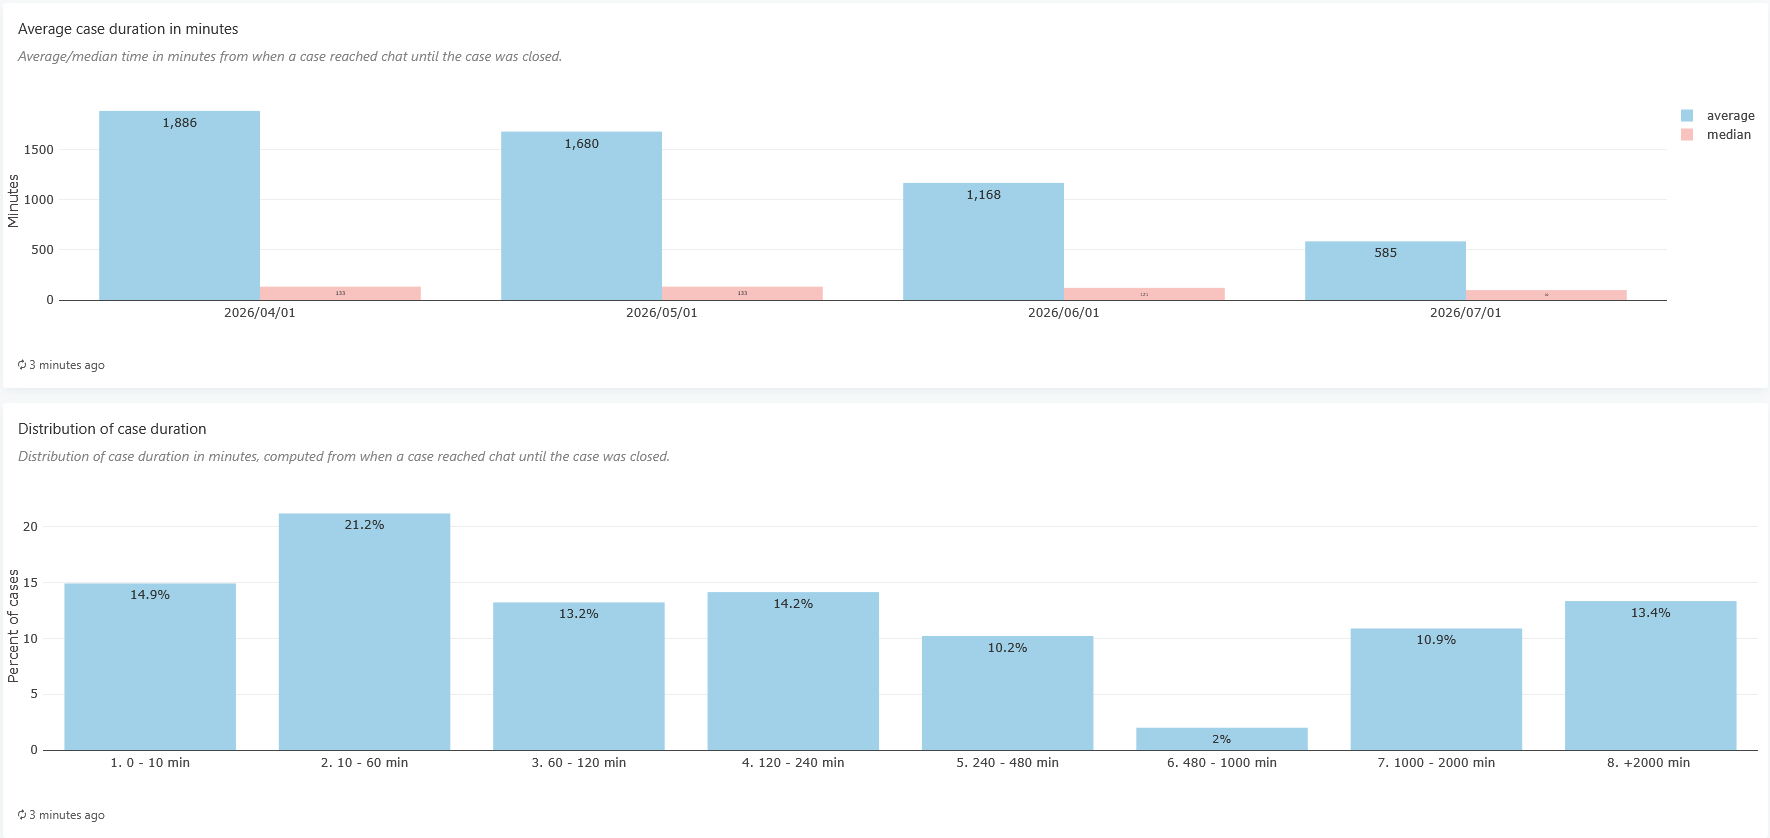
13. Average case duration in minutes
Average and median handling time for cases created within the selected date range and that reached chat. Dropouts are excluded.
| Measure | Filters |
|---|---|
| cases | create date within date range; has reached chat; status = CLOSED; no drop off |
14. Distribution of case duration
Average handling time for cases created within the selected date range, grouped into time slots. Dropouts are excluded.
| Measure | Filters |
|---|---|
| cases | create date within date range; has reached chat; status = CLOSED; no drop off |
Waiting time within opening hours
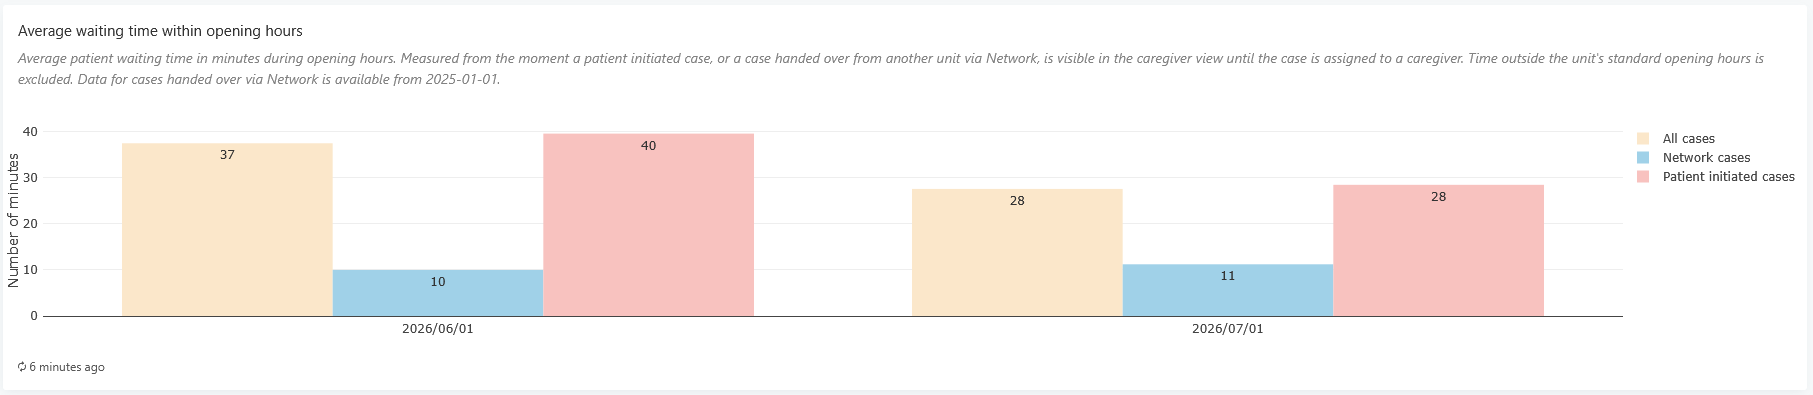
15. Average waiting time within opening hours
Average waiting time between a patient landing in chat and a caregiver picking up the case. Sendout cases are excluded. More details on waiting times calculations.
| Measure | Filters |
|---|---|
| cases | create date within date range; sendout cases excluded |
Waiting times
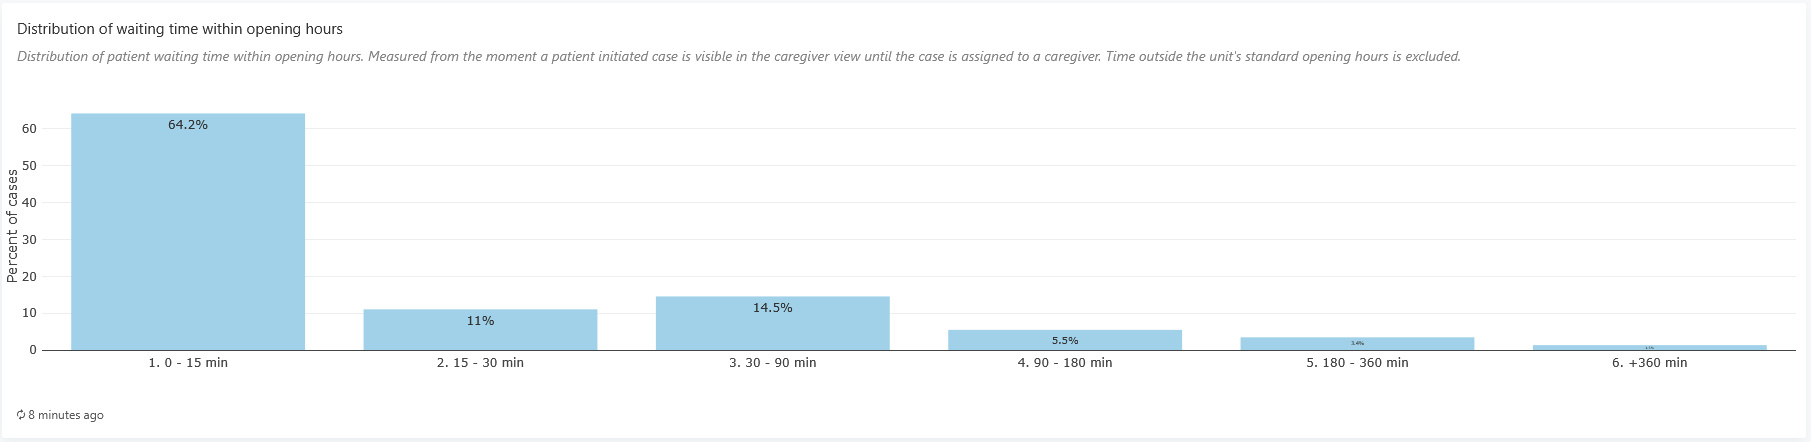
16. Distribution of waiting time within opening hours
Waiting time within opening hours, grouped into time slots. Only patient-initiated cases; dropouts excluded.
| Measure | Filters |
|---|---|
| cases | create date within date range; sendout cases excluded; no drop off |
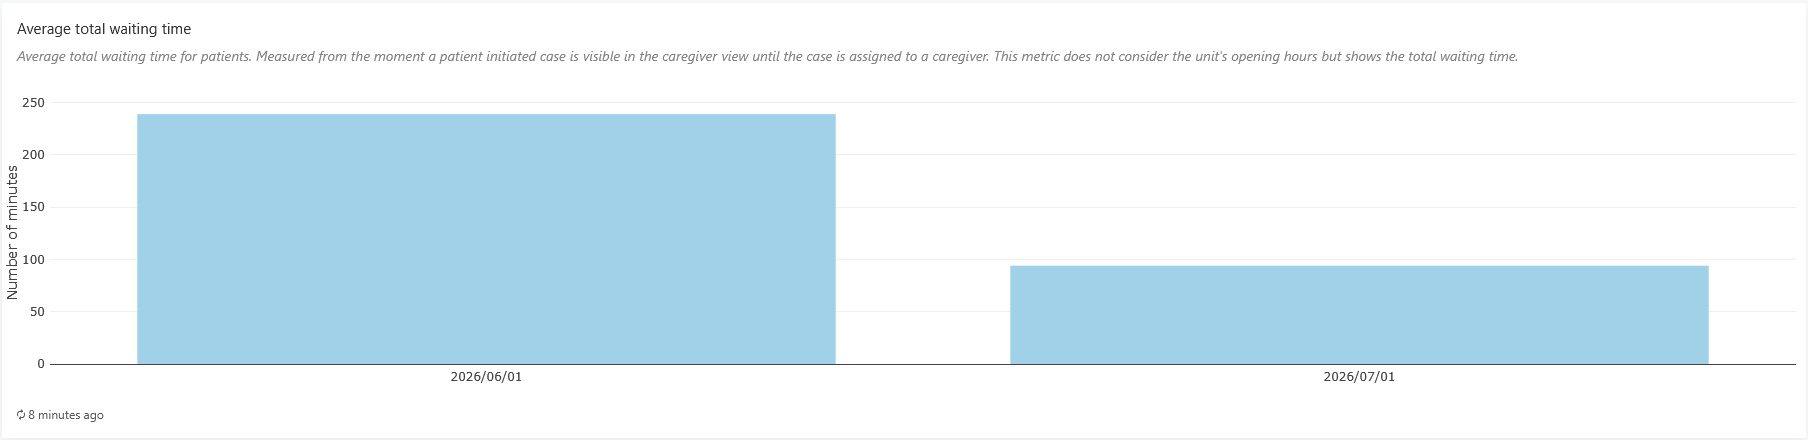
17. Average total waiting time
Average waiting time (unit opening hours are not taken into account), for cases created within the selected date range. No sendouts.
| Measure | Filters |
|---|---|
| cases | create date within date range; sendout cases excluded; no drop off |
Drop-offs
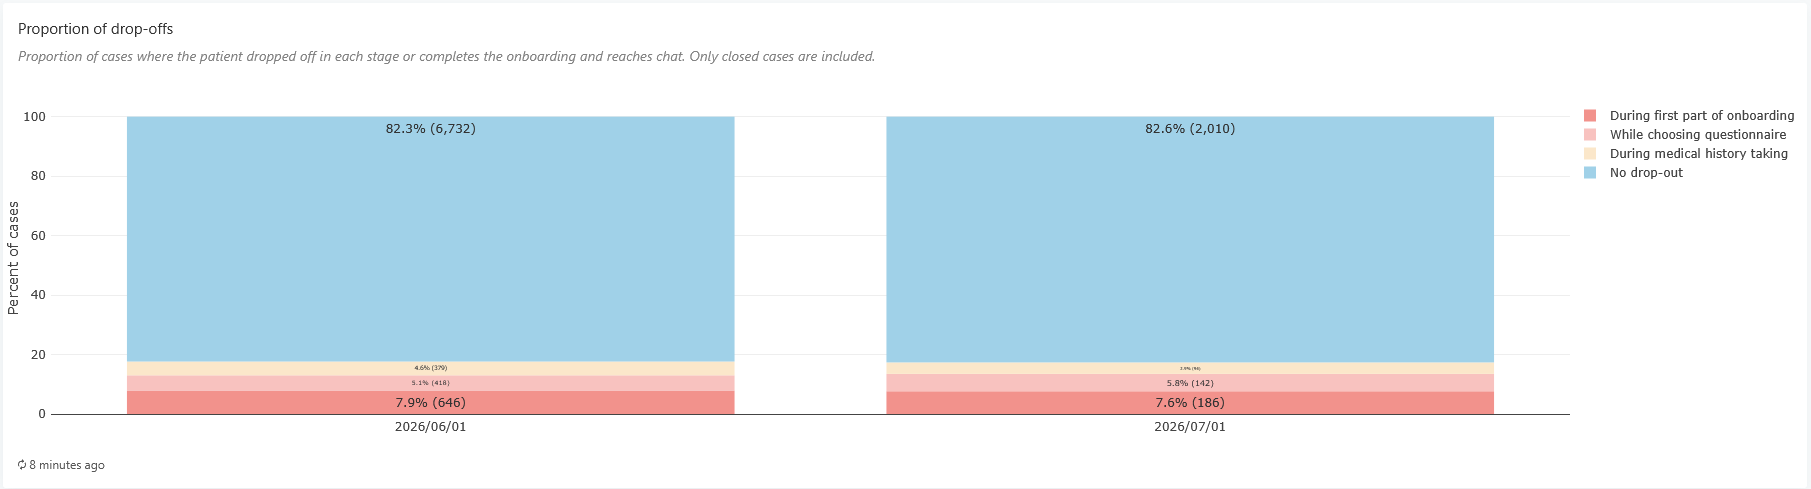
18. Proportion of drop-offs
Drop-off stage as a percentage compared with other dropped cases. Includes closed cases created within the selected date range.
| Measure | Filters |
|---|---|
| cases | create date within date range; only closed cases |
Sendouts
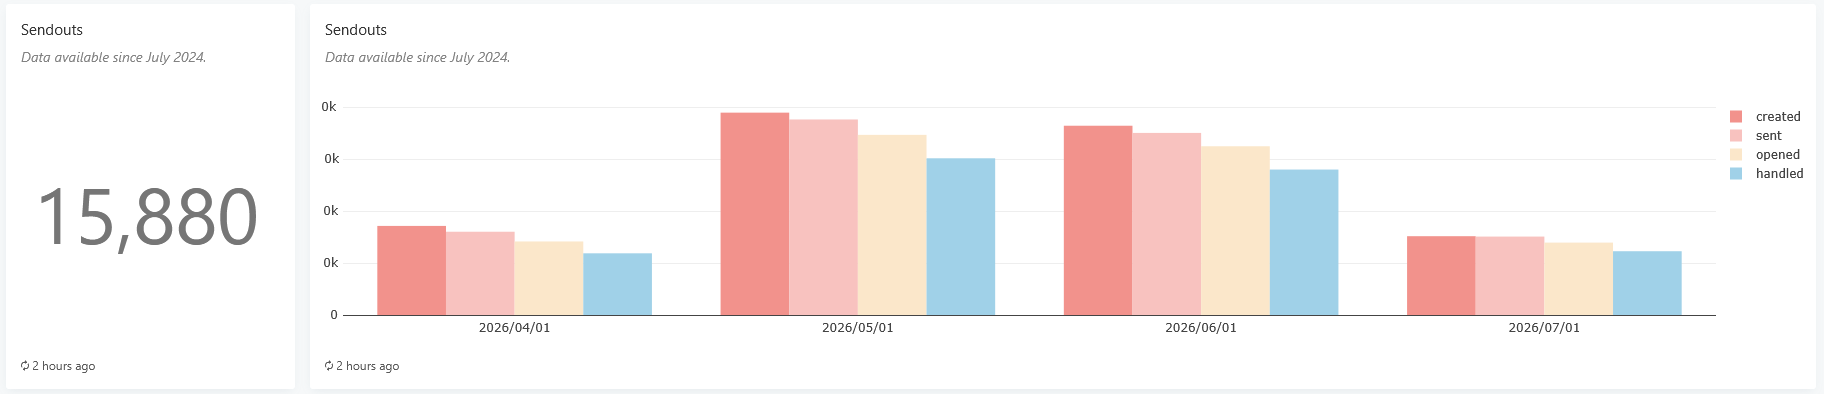
19. Sendouts
Sendouts created within date range.
| Measure | Filter |
|---|---|
| sendout | creation date within the date range |
20. Sendouts
Sendouts created within the selected date range, with number sent/opened/handled grouped by time interval.
| Measure | Filter |
|---|---|
| sendout | creation date within the date range |
Profession collaboration
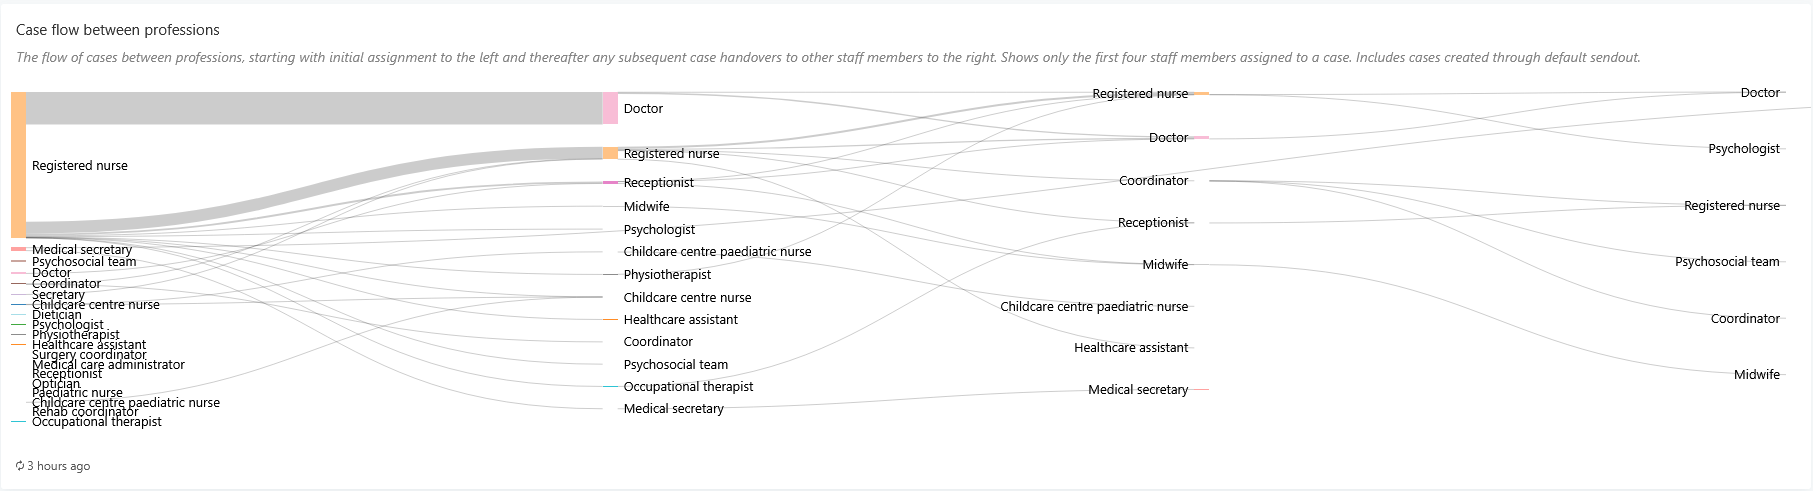
21. Case flow between professions
Shows the first 4 professions assigned to a case. All cases created within the selected date range.
| Measure | Filters |
|---|---|
| cases | create date within date range |
Video calls
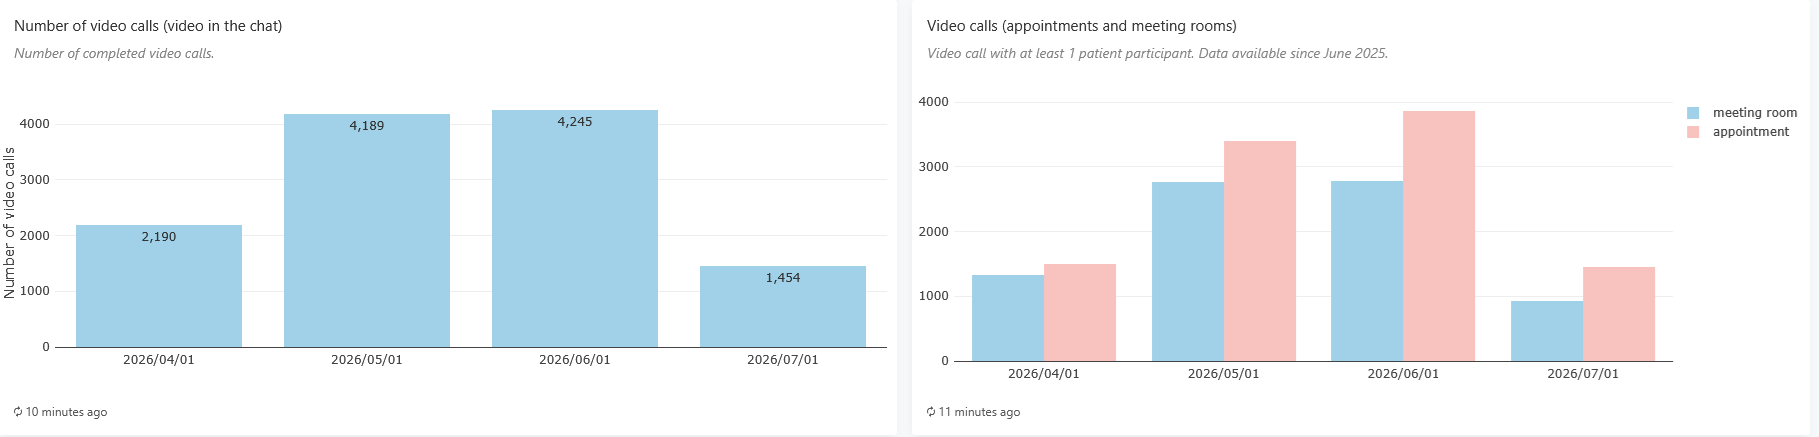
22. Number of video calls (video in chat)
All completed case videos created within the selected date range, grouped by time interval.
| Measure | Filters |
|---|---|
| case video calls | video date within date range |
23. Video calls (appointments and meeting rooms)
Number of videos (appointments and meeting rooms). Videos under 1 minute are filtered out.
| Measure | Filters |
|---|---|
| video calls | video start date within date range; at least 60 seconds long |
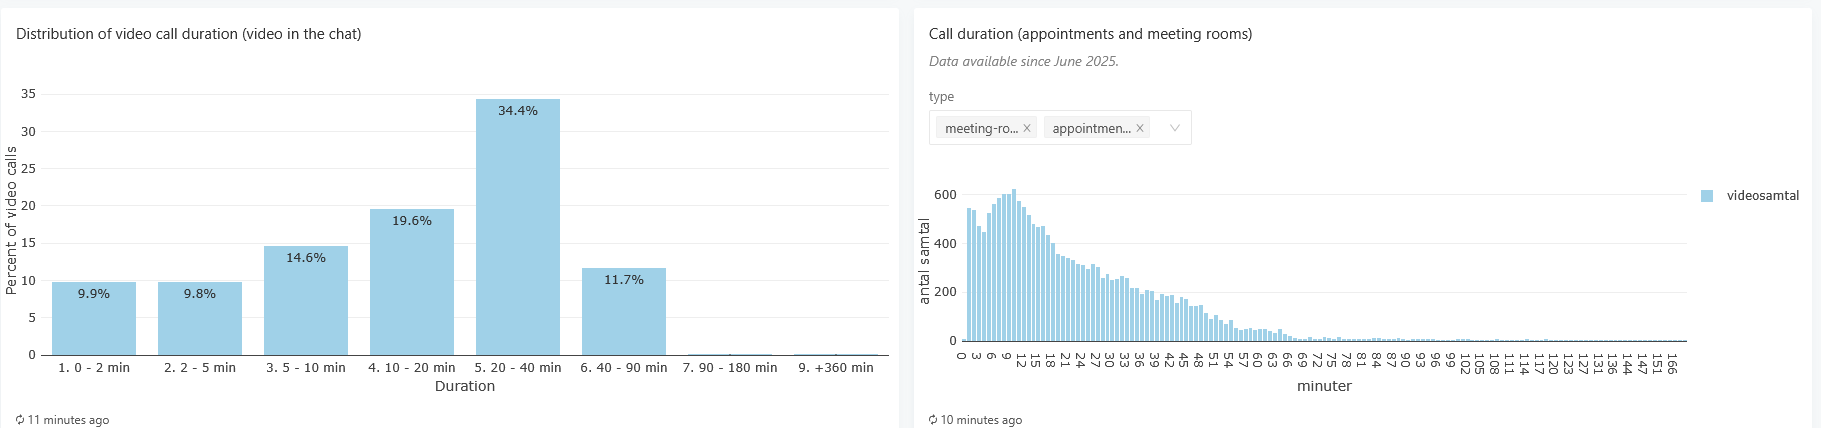
24. Distribution of video call duration (video in chat)
Videos (appointments and meeting rooms) grouped by length in minutes. Videos under 1 minute are filtered out.
| Measure | Filters |
|---|---|
| video calls | video start date within date range; at least 60 seconds long |
25. Call duration (appointments and meeting rooms)
Videos (appointments and meeting rooms) grouped by length in minutes. Videos under 1 minute are filtered out.
| Measure | Filters |
|---|---|
| video calls | video start date within date range; at least 60 seconds long |
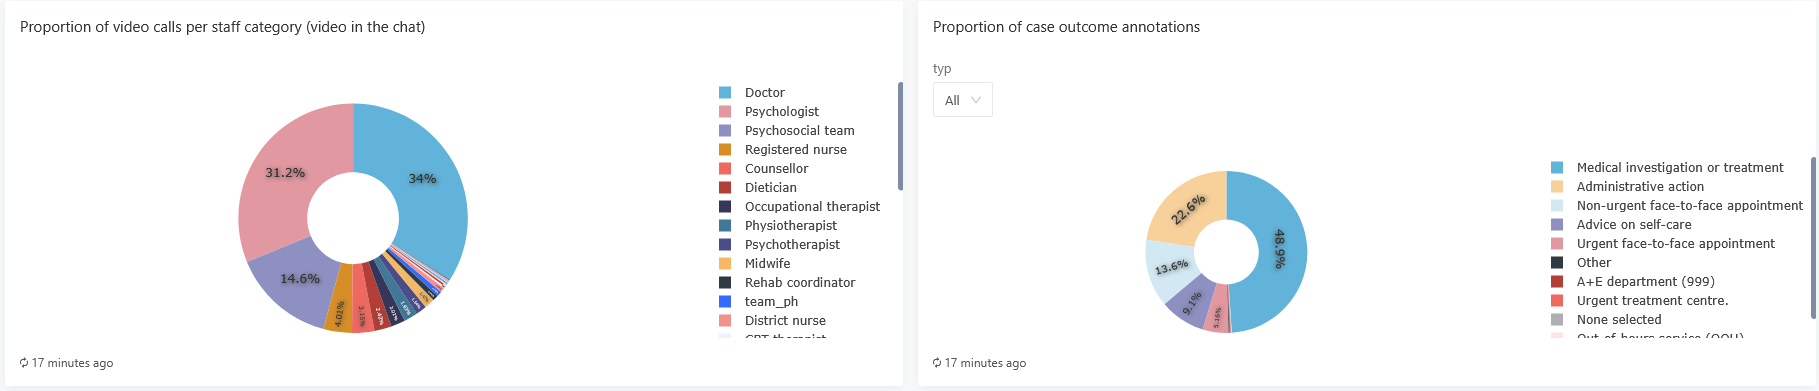
26. Proportion of video calls per staff category
Profession split (%) for completed case videos created within the selected date range.
| Measure | Filters |
|---|---|
| case video calls | video date within date range; only completed video calls |
27. Proportion of video calls per staff category
Case feedback value (post-tag value) for all cases within the selected date range. Cases without a feedback value are not included. The typ filter inside the widget limits results to patient / caregiver / both case types.
| Measure | Filters |
|---|---|
| cases | create date within date range; has reached chat; cases without post-tag value excluded |
Widget-only filter: case initiated by — patient / sendout initiated
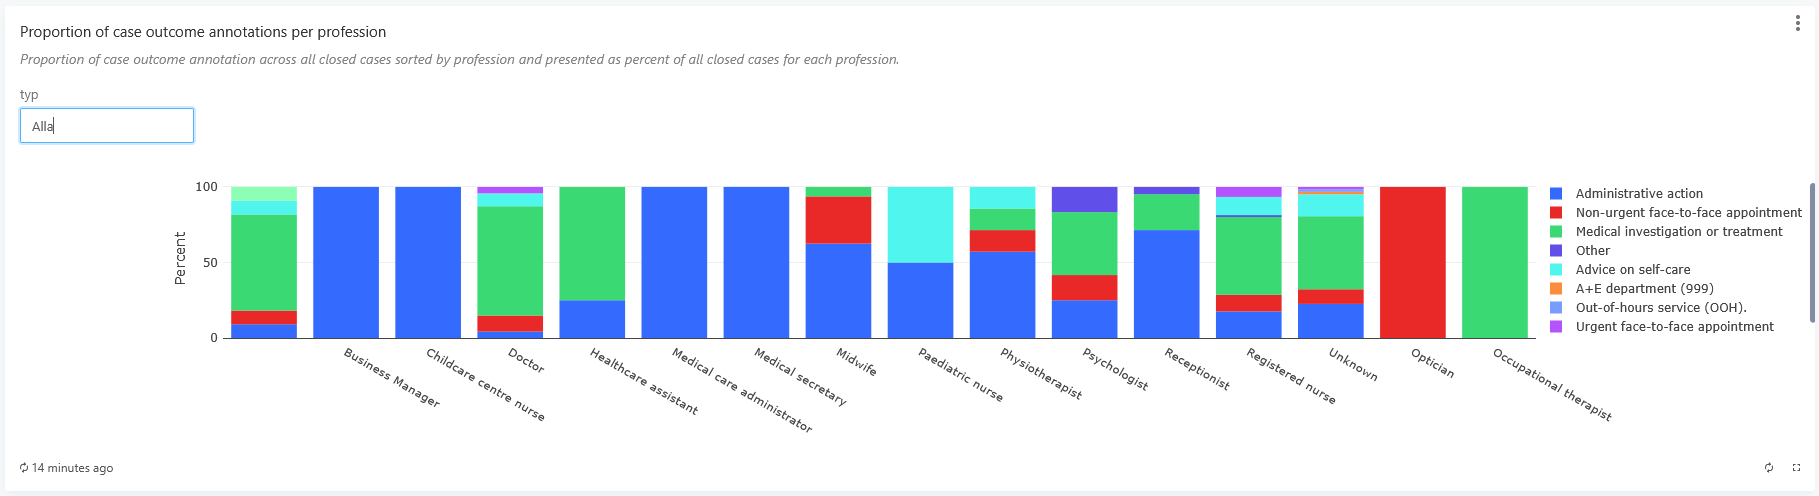
28. Proportion of case outcome annotations per profession
Case feedback value (post-tag value) per profession, for all cases within the selected date range. Cases without a feedback value are not included. The typ filter inside the widget limits results to patient / caregiver / both case types.
| Measure | Filters |
|---|---|
| cases | create date within date range; has reached chat; cases without post-tag value excluded; case had at least 2 assigned roles |
Widget-only filter: case initiated by — patient / sendout initiated
Patient feedback
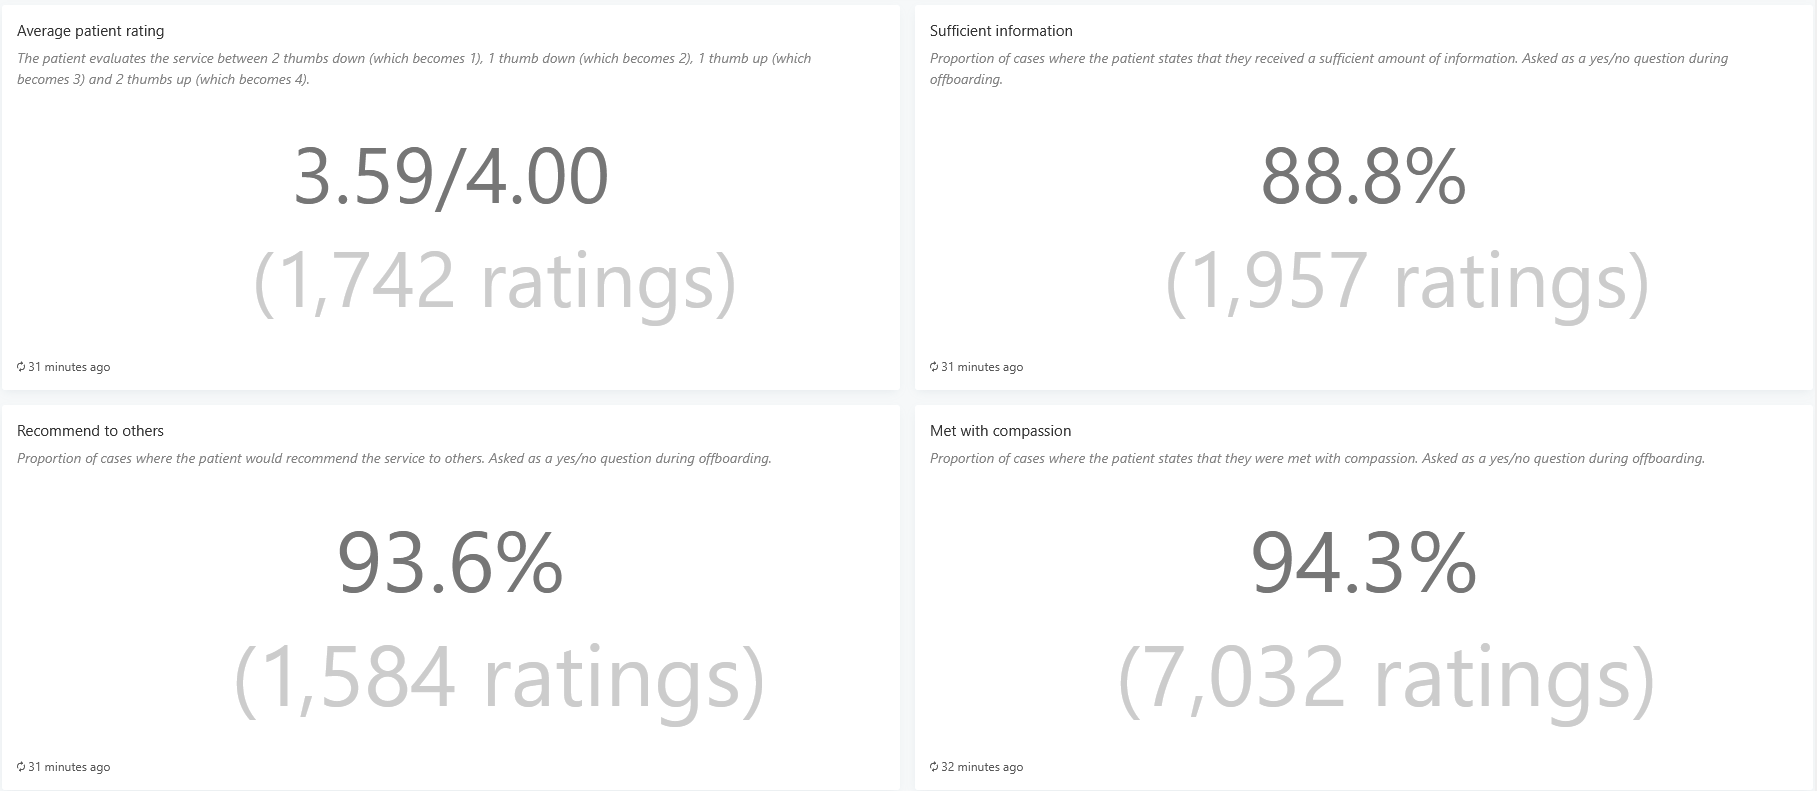
29. Average patient rating
Average rating on cases within the selected date range.
| Measure | Filters |
|---|---|
| cases | create date within date range |
30. Sufficient information
Percentage of patients who felt they got sufficient information. Only cases where this question was answered are included.
| Measure | Filters |
|---|---|
| cases | create date within date range; “information sufficient” question answered |
31. Recommend to others
Percentage of patients who would recommend the solution. Only cases where this question was answered are included.
| Measure | Filters |
|---|---|
| cases | create date within date range; “recommend to others” question answered |
32. Met with compassion
Percentage of patients who noticed compassion. Only cases where this question was answered are included.
| Measure | Filters |
|---|---|
| cases | create date within date range; “compassion_shown” question answered |
Updated on 2026-07-02